• Hands-on Exercises
    • Hands-on Exercise 1
    • Hands-on Exercise 2
    • Hands-on Exercise 3a
    • Hands-on Exercise 3b
    • Hands-on Exercise 4a
    • Hands-on Exercise 4b
    • Hands-on Exercise 4c
    • Hands-on Exercise 4d
    • Hands-on Exercise 5a
    • Hands-on Exercise 5b
    • Hands-on Exercise 5c
    • Hands-on Exercise 5d
    • Hands-on Exercise 5e
    • Hands-on Exercise 6
    • Hands-on Exercise 7a
    • Hands-on Exercise 7b
    • Hands-on Exercise 7c
    • Hands-on Exercise 8
    • Hands-on Exercise 9
  • In-class Exercises
    • In-class Exercise 1
    • In-class Exercise 2
    • In-class Exercise 3
    • In-class Exercise 4
  • Take-home Exercises
    • Take-home Exercise 1
    • Take-home Exercise 2
    • Take-home Exercise 3
    • Take-home Exercise 4
  • Extra Stuff
    • Post-Lesson Thoughts 1
    • Post-Lesson Thoughts 2 (coming soon!)
    • Post-Lesson Thoughts 3

SiHui Learns Visual Analytics!

Welcome to SiHui Learns Visual Analytics! This website documents my learning journey for ISSS608 Visual Analytics and Applications course. Hopefully I can surf through this course smoothly like this penguin!


Hands-On Exercises

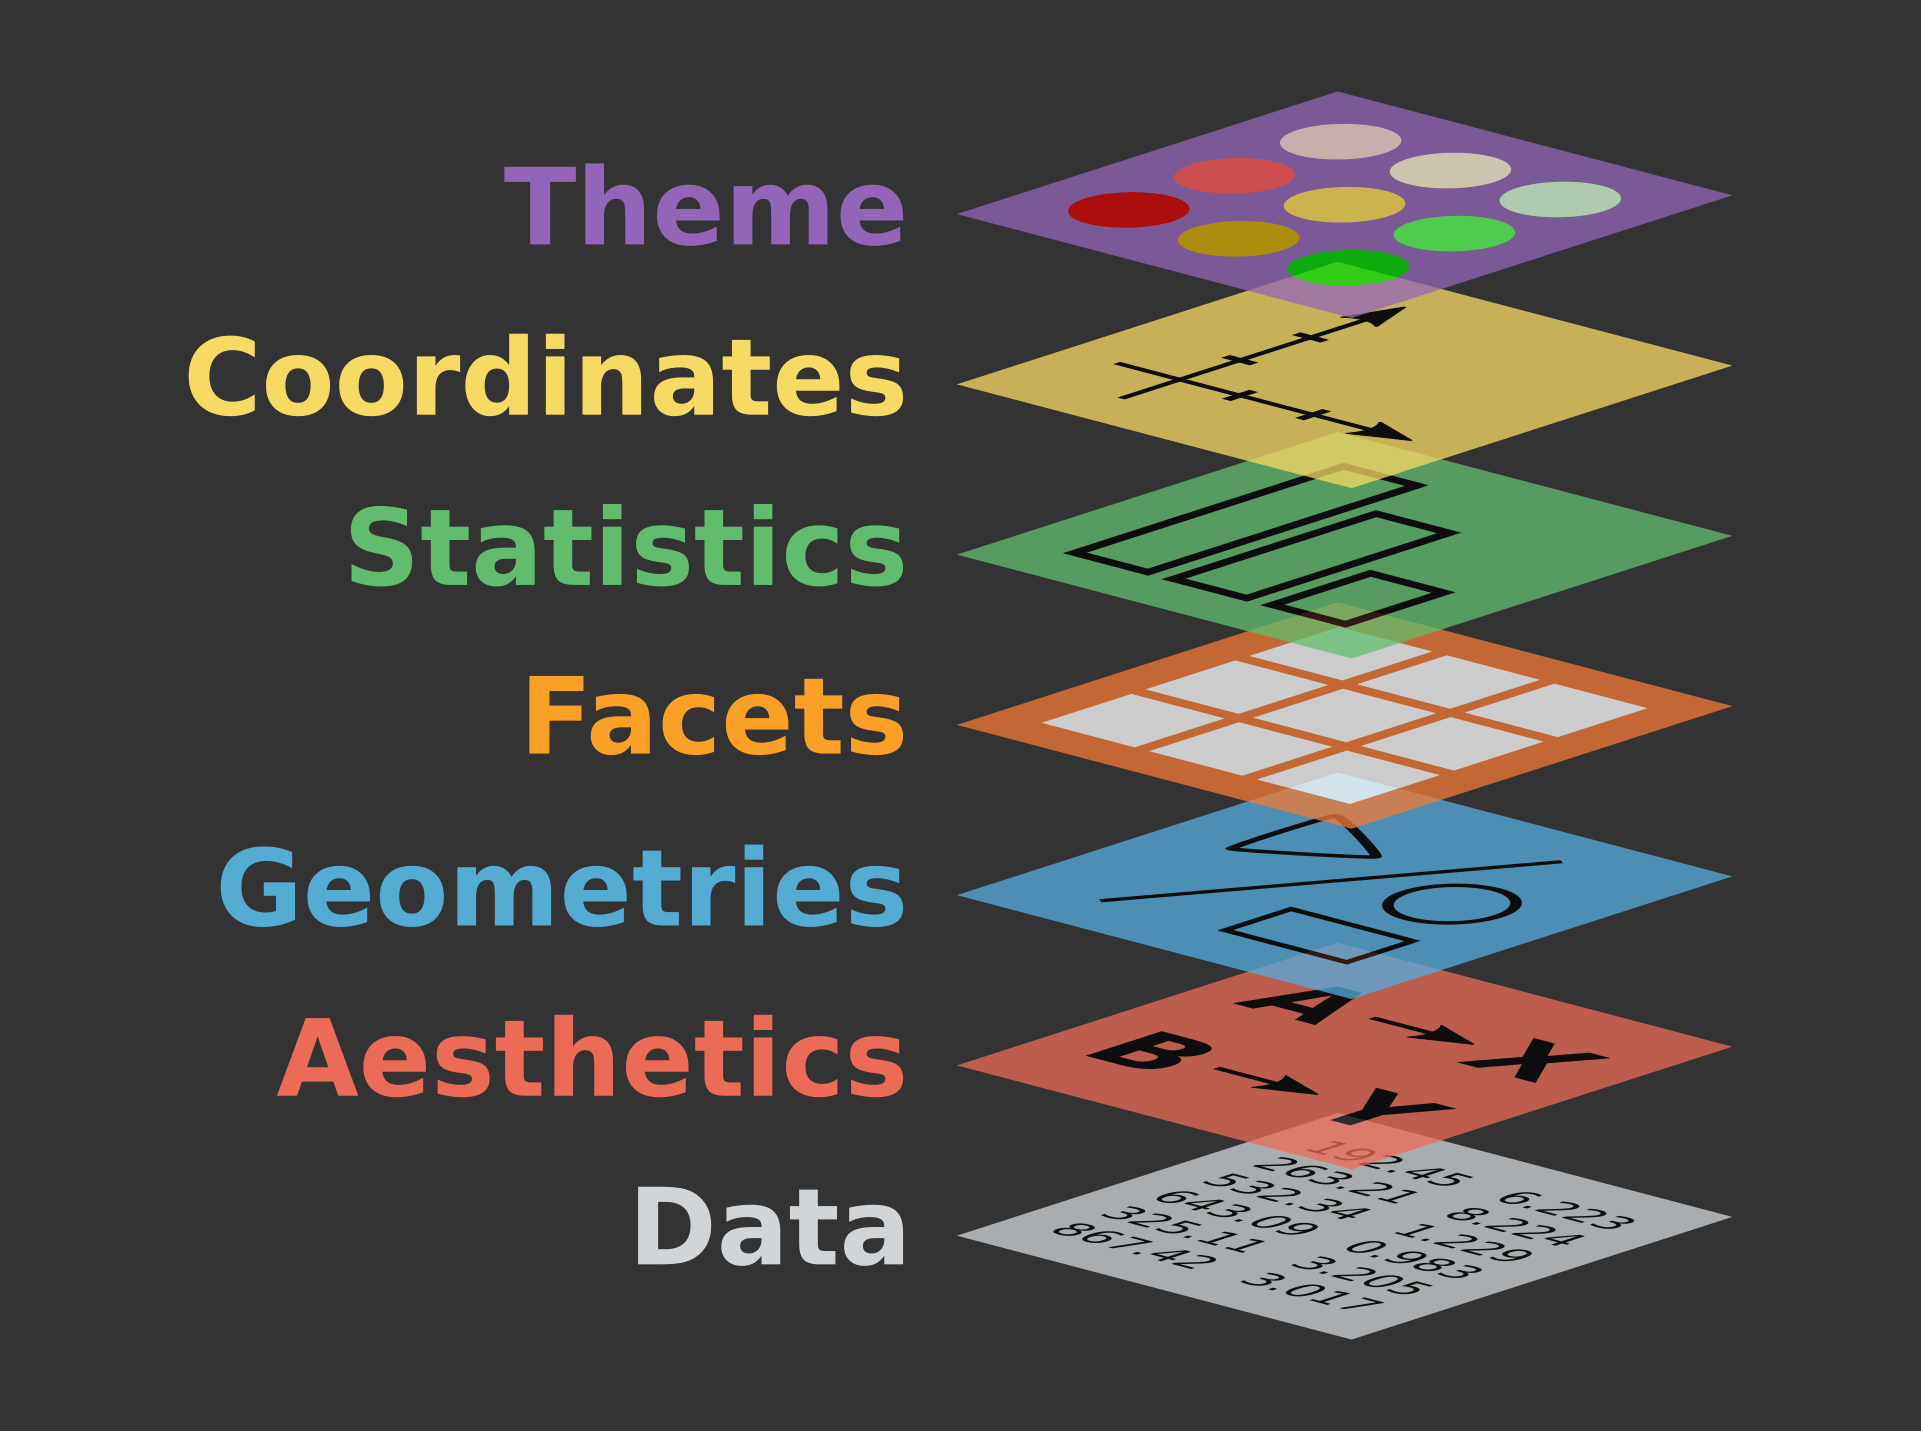
Hands-on Exercise 1: A Layered Grammar of Graphics: ggplot2 methods
[Updated charts with annotations and references on 16 Jan 2024]
Goh Si Hui
Jan 11, 2024

Hands-On Exercise 2: Beyond ggplot2 Fundamentals
In this exercise, we will be introduced to the following ggplot2 extensions to create more elegant and effective statistical graphics:
Goh Si Hui
Jan 13, 2024
 
Hands-On Exercise 3a: Programming Interactive Data Visualisation with R
[Updated with in-class notes on 3 Feb 2024]
Goh Si Hui
Jan 22, 2024

Hands-On Exercise 3b: Programming Animated Statistical Graphics with R
In this exercise, we will learn how to create animated data visualisation by using gganimate and plotly r packages. At the same time, we will also learn how to (i) reshape…
Goh Si Hui
Jan 24, 2024

Hands-on Exercise 4a - Visualising Distribution
[Updated with In-class notes on 3 Feb 2024 and an interactive raincloud plot!]
Goh Si Hui
Feb 1, 2024

Hands-on Exercise 4b - Visual Statistical Analysis
In this hands-on exercise, we will learn how to:
Goh Si Hui
Feb 1, 2024

Hands-on Exercise 4C - Visualising Uncertainty
In this hands-on exercise, we will learn how to:
Goh Si Hui
Feb 1, 2024

Hands-on Exercise 4d - Funnel Plots for Fair Comparisons
In this exercise, we will learn how to plot the following:
Goh Si Hui
Feb 1, 2024

Hands-on Exercise 5a - Creating Ternary Plot with R
In this exercise, we will learn how to build ternary plot programmatically using R for visualising and analysing population structure of Singapore.
Goh Si Hui
Feb 7, 2024

Hands-on Exercise 5b - Visual Correlation Analysis
In this exercise, we will learn how to visualise correlation matrix using R. There are 3 main sections of this exercise. First, we will learn how to create a correlation…
Goh Si Hui
Feb 8, 2024

Hands-on Exercise 5c: Heatmap for Visualising and Analysing Multivariate Data
In this exercise, we will learn how to use R to plot static and interactive heatmap for visualising and analysing multivariate data.
Goh Si Hui
Feb 8, 2024

Hands-on Exercise 5d - Visual Multivariate Analysis with Parallel Coordinates Plot
In this exercise, we will learn how to:
Goh Si Hui
Feb 8, 2024

Hands-on Exercise 5e - Treemap Visualisation with R
In this exercise, we will learn how to design treemap using appropriate R packages. The hands-on exercise consists of three main section. First, you will learn how to…
Goh Si Hui
Feb 9, 2024

Take-home Exercise 6 - Visualing and Analysing Time-Oriented Data
In this exercise, we will be learning how to create the following visualisations:
Goh Si Hui
Feb 20, 2024

Take-home Exercise 7a: Choropleth Mapping with R
In this exercise, we will learn how to plot functional and truthful choropleth maps using tmap package.
Goh Si Hui
Feb 25, 2024
 
Hands-on Exercise 7b: Visualising Geospatial Point Data
In this exercise, we will learn how to: - convert an aspatial data file into simple point feature data frame, and assign it an appropriate projection reference to the newly…
Goh Si Hui
Feb 26, 2024

Hands-on Exercise 7c: Analytical Mapping
In this exercise, we will learn how to plot analytical map such as rate map, percentile map and boxmap.
Goh Si Hui
Feb 26, 2024

Hands-on Exercise 8: Modelling, Visualising and Analysing Network data with R
[Added date modified field on 16 Mar as I realised it was missing]
Goh Si Hui
Mar 3, 2024

Hands-on Exercise 9
By the end of this hands-on exercise, we will be able to:
Goh Si Hui
Mar 12, 2024
No matching items

    In-Class Exercises

    In-class Exercise 1: Now You See it!
    First, let us ensure that the required R packages have been installed and import the relevant data for this hands-on exercise.
    Goh Si Hui
    Jan 12, 2024

    In-class Exercise 2: Horizon Plot
    First, let us ensure that the required R packages have been installed and import the relevant data for this hands-on exercise.
    Goh Si Hui
    Feb 24, 2024

    In-class Exercise 3
    Updated this exercise with kriging
    Goh Si Hui
    Mar 9, 2024

    In-class_Ex04
    First, let us install and launch the relevant packages needed for this exercise using pacman::p_load().
    Goh Si Hui
    Mar 16, 2024
    No matching items

    Take-Home Exercises

    Take-home Exercise 1
    Programme for International Student Assessment (PISA) is a study conducted by the Organisation for Economic Co-operation and Development (OECD) that measures 15-year-olds’…
    Goh Si Hui
    Jan 14, 2024

    Take-home Exercise 2
    In this take-home exercise, I will be using the data visualisation design principles and best practices learnt in ISSS608 Lesson 1 and 2 to improve on my peer’s…
    Goh Si Hui
    Jan 25, 2024

    Take-home Exercise 3: Be Weatherwise or Otherwise
    According to Ministry of Sustainability and the Environment, the daily mean temperature is projected to increase by 1.4 to 4.6 Degree Celsius by the end of the century.
    Goh Si Hui
    Feb 12, 2024

    Take-home Exercise 4: Prototyping Time Series Module for Shiny Application
    In this exercise, we will be preparing the time-series forecasting module of the proposed Shiny Application and complete the following task:
    Goh Si Hui
    Feb 25, 2024
    No matching items

    Extras

    Additional practices and experiments can be found here!

    Post-Lesson Thoughts 1: Annotations
    [Updated with references on 16 Jan 2024]
    Goh Si Hui
    Jan 13, 2024
     
    Exploring and Forecasting Time Series using timeTK and Modeltime
    Work in progress
    Goh Si Hui
    Mar 17, 2024
    No matching items
    • Published with Quarto |

    • Hosted by Netlify